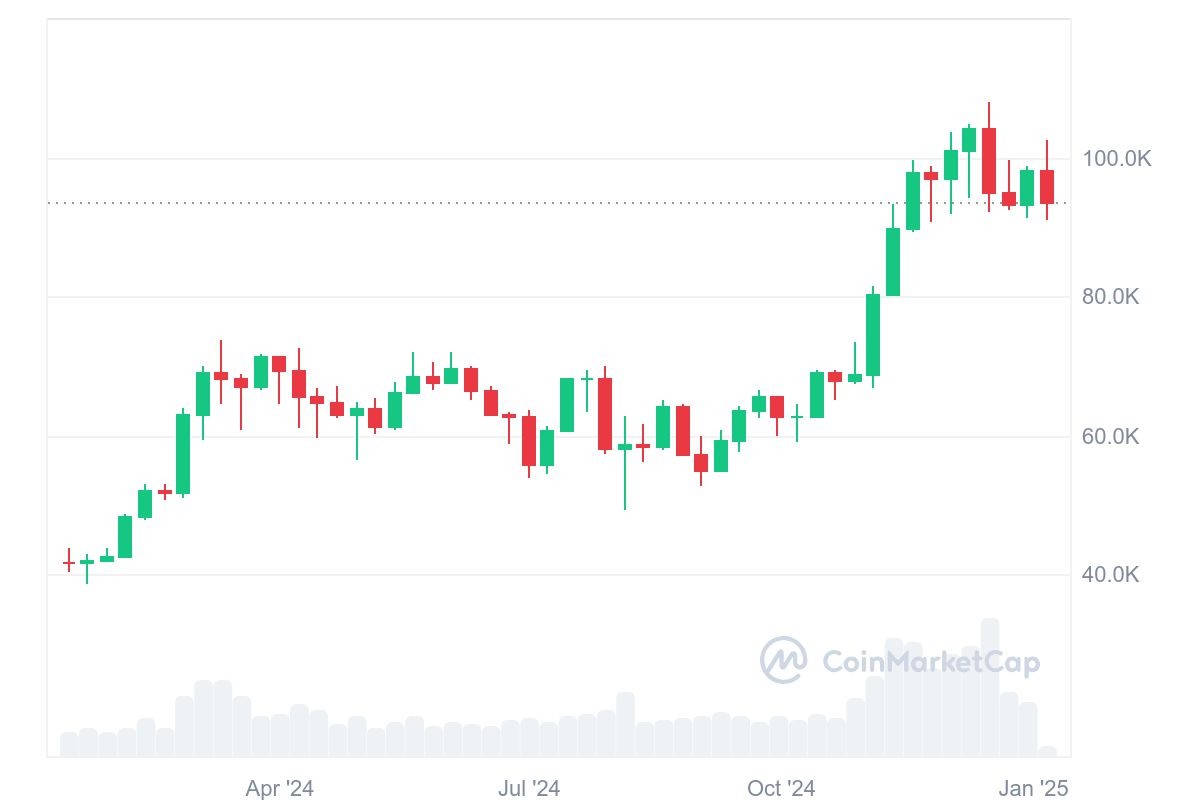
Bitcoin has recently experienced a notable downturn, falling from highs above $100,000 to around $91,200. This sudden decrease has caused significant ripples throughout the cryptocurrency market, leading to substantial liquidations and uncertainty among traders.
Let’s delve into the reasons behind Bitcoin’s current decline and analyze whether the BTC price is likely to recover in the near future.
Immediate Bitcoin Price Decline: A Snapshot
On Friday, January 10, 2025, Bitcoin’s price found support after a three-day slide, halting at a crucial local support level. This pause came after a brief climb above the $100,000 psychological threshold. However, the dip below the 50-day exponential moving average has sparked technical concerns. Despite this, the current price levels are consistent with the local lows seen during a consolidation period since mid-November. This downward trend isn’t isolated to Bitcoin; other major cryptocurrencies like XRP and Cardano have also experienced similar declines recently.
Cryptocurrency market downturn showing major cryptocurrencies in red. Source: CoinMarketCap.com
According to Paul Howard, Senior Director at Wincent, “There is speculation that the recent market downturn began when the Department of Justice (DoJ) started selling some of its Bitcoin holdings from the Silk Road seizure. A wallet ID is suspected to be linked to these sales.” Howard also noted, “This month was anticipated to be volatile, particularly as we approach January 20th and President Trump’s inauguration. However, volatility also presents trading opportunities.”
Currently, Bitcoin is trading at $94,300, having rebounded from its recent lows. Let’s explore the underlying factors contributing to this Bitcoin price drop.
Decoding the Bitcoin Dip: Key Factors
Several factors are contributing to the current downward pressure on Bitcoin and the broader crypto market. These can be broadly categorized into macroeconomic factors, government actions, and shifts in institutional sentiment.
Macroeconomic Headwinds: Stronger US Economic Data
The primary driver behind this Bitcoin price decline is the release of stronger-than-expected economic data from the United States, particularly concerning the services sector and the labor market. This robust economic performance has dampened expectations for aggressive interest rate cuts by the Federal Reserve in 2025. Consequently, Treasury yields have risen, and the U.S. dollar has strengthened.
This macroeconomic environment typically puts downward pressure on risk assets like Bitcoin. When the dollar strengthens, and yields increase, assets like Bitcoin become less attractive compared to safer, yield-bearing investments. The market reaction has been significant, with over $390 million in total crypto liquidations in the past 24 hours, including approximately $54 million in Bitcoin positions alone. This indicates a high degree of leverage in the market and the speed at which downturns can intensify.
Bitcoin leveraged positions liquidation data chart. Source: Coinglass.com
Government Actions: Silk Road Bitcoin Sales
Adding to the downward pressure is the U.S. government’s plan to liquidate a substantial amount of Bitcoin, specifically 69,370 BTC seized from the Silk Road marketplace. This significant volume of Bitcoin, valued at approximately $6.5 billion, is slated for sale through the U.S. Marshals Service. This news injects uncertainty into the market, as the large sale could increase supply and further depress prices. Market participants are wary of the potential impact of such a large sell-off on Bitcoin’s price.
Institutional Investor Sentiment Shift
Beyond macroeconomic and governmental factors, there’s evidence of weakening institutional sentiment towards Bitcoin. This is reflected in significant outflows from Bitcoin ETFs and a general decline in confidence among major investors. After a period of strong inflows into Bitcoin ETFs, a reversal in this trend can exert selling pressure. Institutional investors, who often trade in larger volumes, can significantly influence market direction. Declining institutional interest can signal a broader shift in market sentiment, contributing to the Bitcoin price drop.
Bitcoin Price Technical Analysis: Is it a Correction or a Crash?
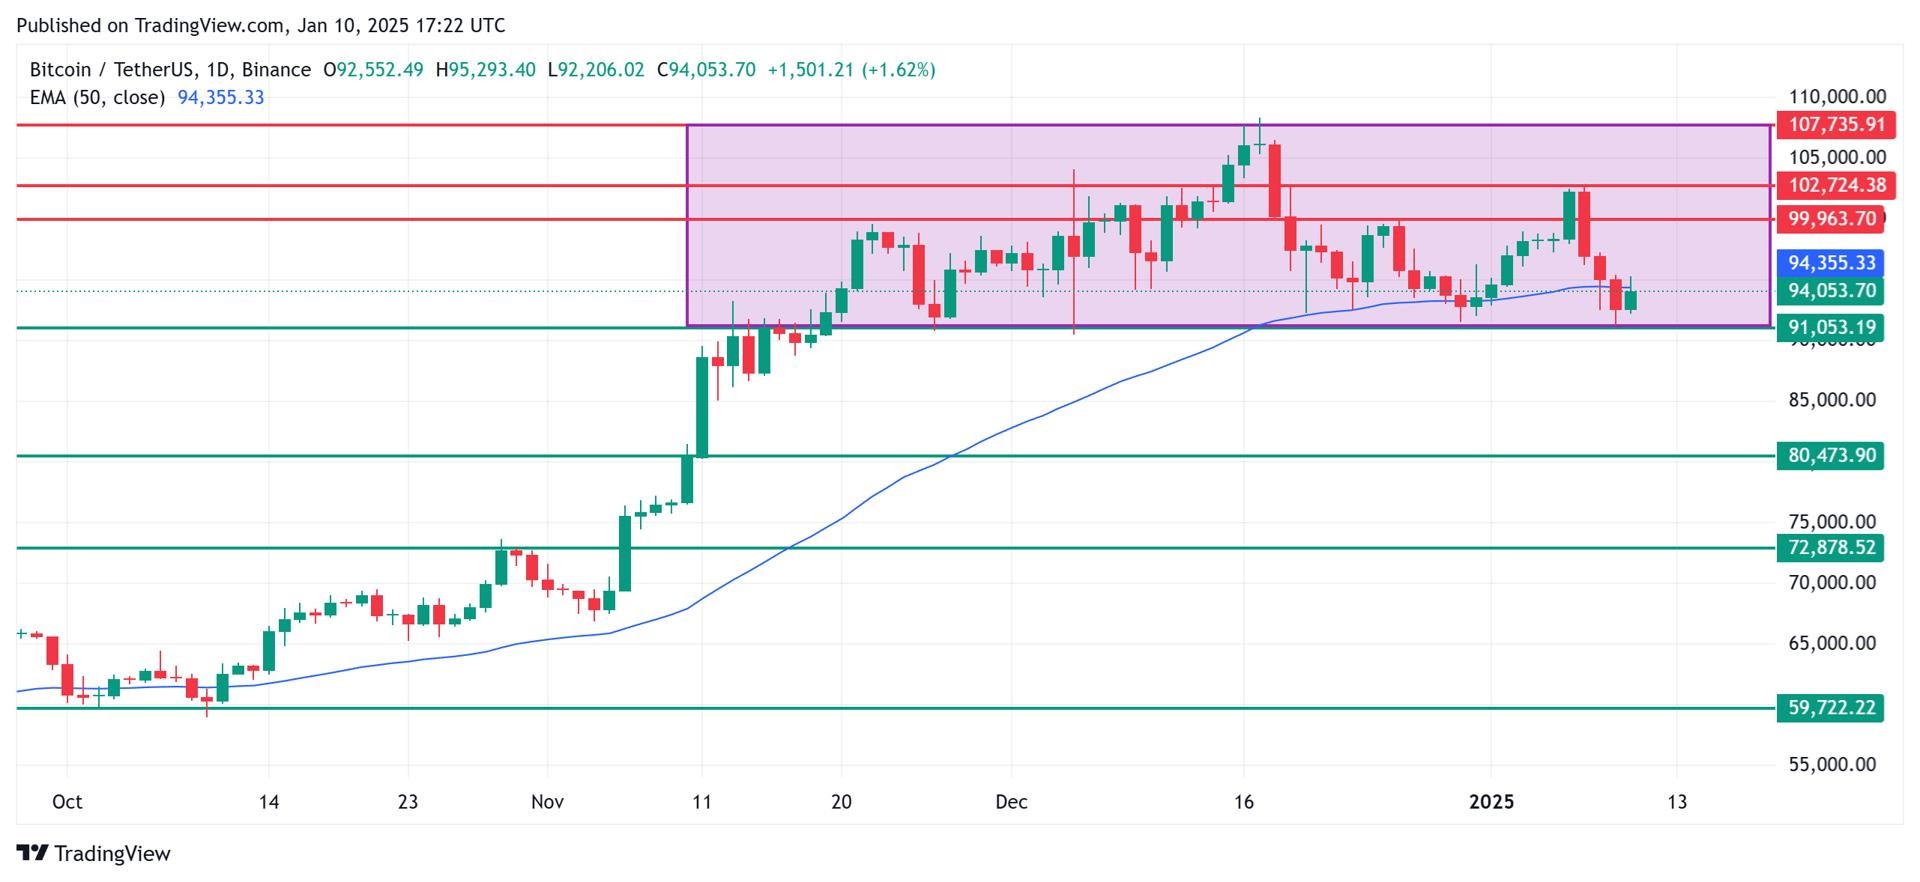
From a technical analysis standpoint, Bitcoin’s price is currently testing the lower end of a consolidation channel that has been in place since mid-November. While the price has dipped below the 50-day EMA, this may not be a cause for alarm for long-term Bitcoin bulls. As long as the price remains within the sideways channel, bounded by the $91,000 support and the $108,000 resistance, the overall market structure remains intact.
Bitcoin price technical analysis chart showing support and resistance levels. Source: Tradingview.com
Even if the current consolidation pattern breaks down, it could present a buying opportunity for investors looking to acquire Bitcoin at lower prices. Key support levels to watch below the current price include $80,500, which corresponds to the local highs from mid-November, and further down at $73,000, representing the peaks from October. A drop below $73,000 would be a more concerning signal, potentially indicating that sellers are gaining stronger control.
Critical support lies near $60,000, the lows from three months prior. Many analysts view price movements above these levels as healthy corrections within a larger uptrend.
On the upside, resistance levels for Bitcoin include the upper boundary of the consolidation channel around $108,000, just under $100,000 (November peaks), and $102,700 (recent highs).
Bitcoin price support and resistance zones
| Type | Zone/Level | Description |
|---|---|---|
| Support | $91,000 | Lower boundary of consolidation channel |
| Support | $80,500 | Mid-November local highs |
| Support | $73,000 | October peaks |
| Support | $60,000 | Three-month lows, buyer/seller divide |
| Resistance | $100,000 | Mid-November peaks |
| Resistance | $102,700 | Recent yearly highs |
| Resistance | $108,000 | Upper boundary of consolidation channel |


Future Outlook: Bitcoin Price Predictions
Despite the current pullback, numerous analysts maintain a bullish long-term outlook for Bitcoin. Standard Chartered Bank, for example, projects a Bitcoin price target of $200,000 by the end of 2025. Other prominent analysts have provided forecasts ranging from $150,000 to $250,000.
These optimistic projections are based on factors like increasing institutional adoption of Bitcoin, the ongoing impact of Bitcoin ETFs in opening up access for investors, and the anticipation of potentially more favorable regulatory environments for cryptocurrencies under new political administrations.
Here’s a summary of recent Bitcoin price predictions:
| Source | Predicted Price | Timeframe | Notes |
|---|---|---|---|
| H.C. Wainwright | $225,000 | End of 2025 | Expects significant bull market |
| Standard Chartered | $200,000 | 2025 | Driven by institutional adoption |
| Fundstrat Global Advisors | $250,000 | 2025 | Favorable market conditions cited |
| Chamath Palihapitiya | $500,000 | October 2025 | Long-term potential, $1M by 2040 |
| PlanB (Stock-to-Flow Model) | $800,000 | 2025 | Based on Stock-to-Flow model |
| CoinLore | $222,000 | 2025 | Continued growth to 2030 |
| Finder’s Panel | $113,300 | End of 2025 | Average industry prediction |
| Changelly | $115,000 | 2025 | Max price forecast |
| BeInCrypto | $189,300 | 2025 | Historical price patterns considered |
| MarketWatch | $150,000 | 2025 | Post-halving rallies expectation |
The immediate focus for the market is whether Bitcoin can stabilize and regain momentum above the $100,000 level. Historically, Bitcoin corrections are often followed by significant rallies, particularly within its typical four-year market cycle.
Bitcoin Price Drop: FAQs
Will Bitcoin Crash?
While Bitcoin has seen a significant price decrease, currently around $91,200, most analysts view it as a healthy correction rather than a crash. Key support levels at $91,000 and $80,500 are expected to provide price floors. A drop below $73,000 or $60,000 could indicate a more bearish scenario, but this is not the prevailing expectation.
Will Bitcoin Go Back Up?
Bitcoin has already shown signs of recovery, rebounding to $94,300 from recent lows. Long-term forecasts remain largely positive, with many analysts predicting prices between $150,000 and $250,000 by 2025. Institutional adoption and the continued influence of Bitcoin ETFs are expected to be key drivers of future price appreciation.
Why Is Bitcoin Down?
The recent Bitcoin price drop is primarily due to stronger-than-anticipated U.S. economic data, which has reduced expectations for Federal Reserve interest rate cuts. This has led to a stronger dollar and higher Treasury yields, creating a less favorable environment for cryptocurrencies. Additionally, the U.S. government’s planned sale of seized Bitcoin and a decrease in institutional investor confidence have contributed to selling pressure.
How Much is Bitcoin Worth?
As of the latest update, Bitcoin is trading at approximately $94,300, having recovered from a low of $91,200. It is currently below the $100,000 mark but is consolidating within a range of $91,000 to $108,000.