Gasoline prices at the pump are on the rise again, leaving many drivers wondering why. As of this week, the national average for a gallon of gas has climbed to $3.10, a four-cent increase from the previous week. This upward trend occurs even with domestic gasoline demand remaining low, prompting questions about the underlying causes. To understand why you’re paying more at the pump, we need to delve into the dynamics of the oil market and other contributing factors.
According to Andrew Gross, spokesperson for AAA, the primary driver behind these rising gas prices is the increasing cost of crude oil. “Global oil prices have surged,” Gross explains, “due to strong winter heating fuel demand and new U.S. sanctions against Russia’s energy sector.” It’s crucial to recognize that crude oil costs constitute a significant 56% of the final gasoline price. Therefore, any increase in oil prices directly translates to higher prices at the gas station. Despite this national trend, it’s worth noting that 26 states still maintain average gas prices below $3 a gallon, indicating regional variations in pricing.
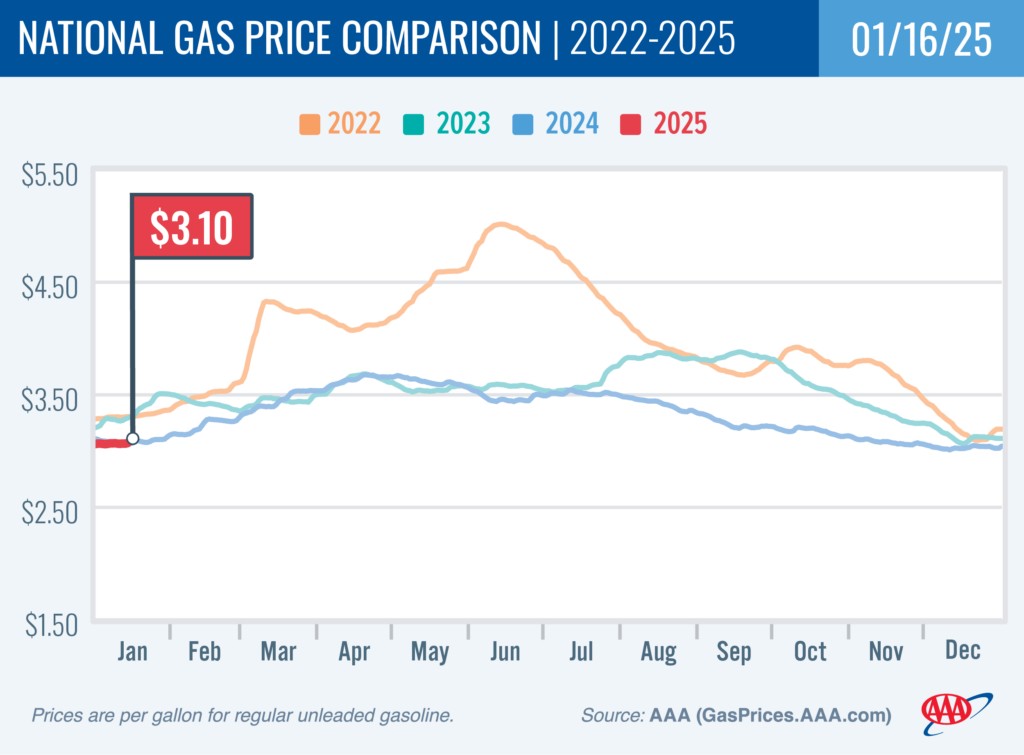 Gas Price Trends in the US: National average gas price comparison chart showing recent increase to .10 per gallon.
Data from the Energy Information Administration (EIA) provides further insight into the current market situation. Gasoline demand has actually decreased, falling from 8.48 million barrels per day last week to 8.32 million. Simultaneously, domestic gasoline inventories have increased from 237.7 million barrels to 243.6 million. Gasoline production also saw a rise, averaging 9.3 million barrels daily last week. This combination of reduced demand and increased supply of gasoline, in normal circumstances, would typically lead to stable or even decreasing prices. However, the overriding factor is the elevated cost of crude oil, which is overshadowing these domestic supply and demand metrics.
Oil Market Dynamics Explained
The price of West Texas Intermediate (WTI) crude oil, a key benchmark, reflects these global pressures. At the close of Wednesday’s trading, WTI surged by $2.54, settling at $80.04 per barrel. The EIA also reported a decrease in U.S. crude oil inventories by 2.0 million barrels from the previous week. Currently, at 412.7 million barrels, U.S. crude oil inventories are approximately 6% below the five-year average for this time of year. This tightening of crude oil supply, combined with strong global demand and geopolitical factors like sanctions, is exerting upward pressure on prices.
Regional Gas Price and Electric Charging Variations
Gas prices and even electric vehicle charging costs can vary significantly across the United States. Here’s a quick look at some of the extremes:
Gasoline Prices:
- Most Expensive Markets: Hawaii ($4.54), California ($4.41), Washington ($3.90), Nevada ($3.66), Oregon ($3.50), Pennsylvania ($3.32), Alaska ($3.31), Illinois ($3.25), Washington, DC ($3.23), and Florida ($3.22).
- Least Expensive Markets: Mississippi ($2.66), Texas ($2.68), Oklahoma ($2.70), Arkansas ($2.71), Louisiana ($2.76), Kentucky ($2.76), Kansas ($2.77), Alabama ($2.79), Missouri ($2.79).
Public EV Charging Costs (per kilowatt hour):
- Least Expensive States: Kansas (22 cents), Nebraska (25 cents), Missouri (25 cents), Delaware (27 cents), Texas (28 cents), Maryland (28 cents), Utah (29 cents), North Dakota (29 cents), Michigan (30 cents), and Iowa (30 cents).
- Most Expensive States: Hawaii (51 cents), Montana (45 cents), West Virginia (45 cents), Idaho (42 cents), New Hampshire (42 cents), Kentucky (42 cents), Arkansas (42 cents), Tennessee (42 cents), Louisiana (41 cents), and South Carolina (41 cents).
For drivers looking to optimize their fuel costs, whether gasoline or electric, resources like the AAA TripTik Travel Planner can provide up-to-date price information along your route.
In Conclusion
While domestic gasoline demand is down and inventories are up, the surge in global crude oil prices, fueled by winter heating demand and geopolitical tensions, is the primary reason behind the current rise in gas prices. External factors impacting the global oil market are currently outweighing typical domestic supply and demand dynamics, leading to higher costs at the pump for consumers across the nation.